Know which visuals earn their keep
Clipixel scores asset usage and ties library activity to commerce outcomes your marketing team already argues about: PDP engagement, campaign reuse, retailer uptake.
Usage that marketing trusts
Downloads, shares, portal views, and embed hits roll up to the asset and the collection. Filter by team, region, or partner so creative ops can see who still lives in personal drives.
Commerce-aware signals
Tagged campaign and SKU fields join to warehouse tables your analysts already maintain. We do not claim a proprietary model that predicts sales in isolation. We surface credible mid-market analytics: which heroes sit on high-engagement PDPs, which kits retailers actually pull, which assets rot unused.
- Snowflake export and scheduled sync
- Campaign and SKU field joins
- Cohort comparison vs catalog average

Signal example
SKU-18422-OLIVE hero · +18% PDP engagement · 640 retailer downloads · recommended for SS26 reorder brief
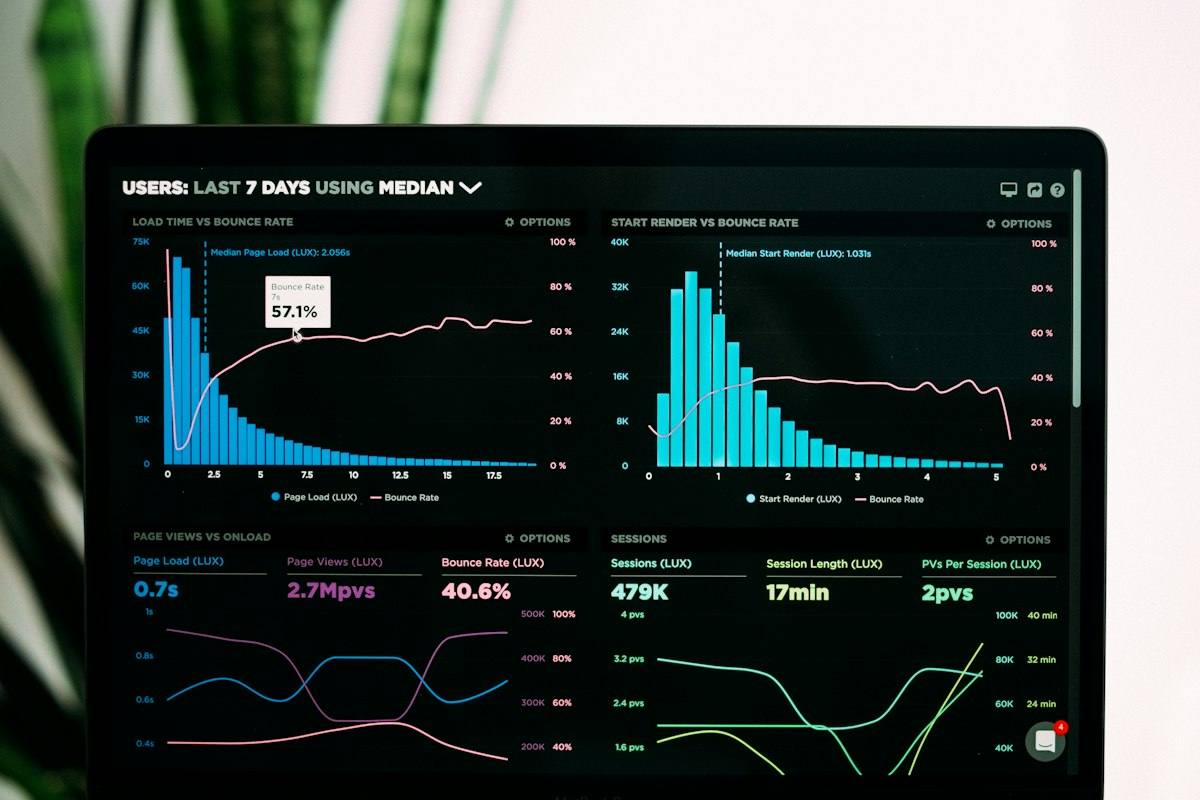
Creative ops dashboards
See who adopts the library, what sits untouched for two seasons, and where portals drive partner activity. Dashboards are readable without a BI ticket.
Exports to your warehouse
Push usage and scored assets to Snowflake (or your existing AWS data path) so analysts keep living in their tools. Clipixel is the system of record for the asset; the warehouse remains yours.
select asset_id, sku, pdp_eng_delta
from clipixel.visual_insights
where season = 'SS26'
order by pdp_eng_delta desc
limit 25;
See Clipixel on your catalog
Fifteen minutes with a product specialist. Bring a messy folder; we will map a cleaner path.